Monday, June 6, 2016

rhel7

systemctl
https://www.digitalocean.com/community/tutorials/how-to-use-systemctl-to-manage-systemd-services-and-units

In systemd, the target of most actions are "units", which are resources that systemd knows how to manage. Units are categorized by the type of resource they represent and they are defined with files known as unit files. The type of each unit can be inferred from the suffix on the end of the file.
For service management tasks, the target unit will be service units, which have unit files with a suffix of.service. However, for most service management commands, you can actually leave off the .servicesuffix, as systemd is smart enough to know that you probably want to operate on a service when using service management commands.
Targets are special unit files that describe a system state or synchronization point. Like other units, the files that define targets can be identified by their suffix, which in this case is .target. Targets do not do much themselves, but are instead used to group other units together. LOAD: Whether the unit's configuration has been parsed by systemd. The configuration of loaded units is kept in memory.
ACTIVE: A summary state about whether the unit is active. This is usually a fairly basic way to tell if the unit has started successfully or not.
SUB: This is a lower-level state that indicates more detailed information about the unit. This often varies by unit type, state, and the actual method in which the unit runs.
Run level 3 is emulated by multi-user.target. Run level 5 is emulated by graphical.target.
service foobar startsystemctl start foobar.serviceUsed to start a service (not reboot persistent)
service foobar stopsystemctl stop foobar.serviceUsed to stop a service (not reboot persistent)
service foobar restartsystemctl restart foobar.serviceUsed to stop and then start a service
service foobar reloadsystemctl reload foobar.serviceWhen supported, reloads the config file without interrupting pending operations.
service foobar condrestartsystemctl condrestart foobar.serviceRestarts if the service is already running.
service foobar statussystemctl status foobar.serviceTells whether a service is currently running.
ls /etc/rc.d/init.d/ls /lib/systemd/system/*.service /etc/systemd/system/*.serviceUsed to list the services that can be started or stopped
chkconfig foobar onsystemctl enable foobar.serviceTurn the service on, for start at next boot, or other trigger.
chkconfig foobar offsystemctl disable foobar.serviceTurn the service off for the next reboot, or any other trigger.
chkconfig foobarsystemctl is-enabled foobar.service; echo $?Used to check whether a service is configured to start or not in the current environment.
chkconfig foobar –listls /etc/systemd/system/*.wants/foobar.serviceUsed to list what levels this service is configured on or off
chkconfig foobar –addNot needed, no equivalent.
who -r
run level
systemctl list-units --type=target list current run level/active target
-systemctl is-active foobar.service
systemctl is-failed foobar.service
if service is currently active(running)
if service has problem start
-systemctl reload-or-restart foobar.service
-systemctl list-units or systemctl
systemctl list-units -a
show active unit by defaultshow all loaded unit (active or not)
-systemctl list-units --all --state=inactive
systemctl list-units --type=service
list all available unit 
chkconfig --listsystemctl list-unit-files --type=servicelist all available unit
-systemctl cat atd.servicedisplay unit loaded in current systemd
-systemctl list-dependencies sshd.service
[--reverse|--before|--after]

-systemctl show atd.servicelow level properties of unit
systemctl list-unit-files
The state will usually be "enabled", "disabled", "static", or "masked". In this context, static means that the unit file does not contain an "install" section, which is used to enable a unit. As such, these units cannot be enabled. Usually, this means that the unit performs a one-off action or is used only as a dependency of another unit and should not be run by itself.
systemctl mask foo.service; systemctl unmask foo.service
link unit to /dev/null, make it unstartable
systemctl edit foo.service
modify unit

loginctl (logind)
journalctl (journald)

firewalld
Use firewall-cmd to manage the rules.
In order from least trusted to most trusted, the pre-defined zones within firewalld are:
  • drop: The lowest level of trust. All incoming connections are dropped without reply and only outgoing connections are possible.
  • block: Similar to the above, but instead of simply dropping connections, incoming requests are rejected with an icmp-host-prohibited or icmp6-adm-prohibited message.
  • public: Represents public, untrusted networks. You don't trust other computers but may allow selected incoming connections on a case-by-case basis.
  • external: External networks in the event that you are using the firewall as your gateway. It is configured for NAT masquerading so that your internal network remains private but reachable.
  • internal: The other side of the external zone, used for the internal portion of a gateway. The computers are fairly trustworthy and some additional services are available.
  • dmz: Used for computers located in a DMZ (isolated computers that will not have access to the rest of your network). Only certain incoming connections are allowed.
  • work: Used for work machines. Trust most of the computers in the network. A few more services might be allowed.
  • home: A home environment. It generally implies that you trust most of the other computers and that a few more services will be accepted.
  • trusted: Trust all of the machines in the network. The most open of the available options and should be used sparingly.
To use the firewall, we can create rules and alter the properties of our zones and then assign our network interfaces to whichever zones are most appropriate.

start firewall:
# systemctl start firewalld.service
Check if firewall is running:
# systemctl status firewalld
# firewall-cmd --state
Configure firewall when firewalld is not running:
# firewall-offline-cmd
Put Lockdown=yes in the config file /etc/firewalld/firewalld.conf to prevent any change to firewall rule. Or
# firewall-cmd --lockdown-on
# firewall-cmd --lockdown-off
# firewall-cmd --query-lockdown
Zones:
These information are stored in /etc/firewalld/firewalld.conf file.
# firewall-cmd --get-default-zone
# firewall-cmd --get-active-zones
# firewall-cmd --get-zones # list all available zones
Create zone:
# firewall-cmd --permanent --new-zone=new-zone
Print zone config:
# firewall-cmd --list-all # list default zone config
# firewall-cmd --zone=home --list-all
# firewall-cmd --list-all-zones # list all config
Change interfeace zone temporarily:
# firewall-cmd --zone=home --change-interface=eth0
Interface always assign to default zone, unless specified with ZONE="zone-name" in the interface cfg /etc/sysconfig/network-scripts/ifcfg-interface. Or change be changed with,
# nmcli con mod "System eth0" connection.zone zone-name 
# firewall-cmd --get-zone-of-interface=eth0
--add-interface
--remove-interface
Change default zone
# firewall-cmd --set-default-zone=home

Source
# firewall-cmd --zone=trusted --list-sources
# firewall-cmd --zone-trusted --add-source=192.168.2.0/24
--get-zone-of-source
--remove-source
--change-source

List of available service:
# firewall-cmd --get-services
detail of the service are defined under /usr/lib/firewalld/services/.
# firewall-cmd --zone=public --add-service=http --permanent
# firewall-cmd --zone=public --add-service={http,https} --permanent
# firewall-cmd --zone=public --list-services
# firewall-cmd --zone=public --remove-service=http --permanent
Add ports
# firewall-cmd --zone=public --add-port=5000/tcp --permanent
# firewall-cmd --zone=public --add-port=4990-4999/udp --permanent
# firewall-cmd --zone=public --list-ports
# firewall-cmd --zone=public --remove-port=5000/tcp --permanent
Define a service"
Create a xml file /etc/firewalld/services/service.xml, use xml under /usr/lib/firewalld/services/ as template. Remember assign correct SELinux context and file permission.
# restorecon /etc/firewalld/services/service.xml
# chmod 640 /etc/firewalld/services/service.xml
Masquerading
# firewall-cmd --zone=external --add-masquerade
# firewall-cmd --zone=external --remove-masquerade
# firewall-cmd --zone=external --query-masquerade
Port Forwarding
# firewall-cmd --zone=external --add-forward-port=port=22:proto=tcp:toport=3753:toaddr=10.0.0.1
--remove-forward-port
--query-forward-port
Direct Rules that bypass firewalld interface
information are stored in /etc/firewalld/direct.xml file.
open port 9000:
# firewall-cmd --direct --add-rule ipv4 filter INPUT 0 -p tcp --dport 9000 -j ACCEPT
# firewall-cmd --direct --get-all-rules
direct
# firewall-cmd --runtime-to-permanent
# firewall-cmd --reload
# systemctl restart network
# systemctl restart firewalld
Rich rules
format:
# firewall-cmd [--zone=zone] --add-rich-rule='rule' [--timeout=timeval]
# firewall-cmd [--zone-zone] --query-rich-rule='rule'
# firewall-cmd [--zone=zone] --remove-rich-rule='rule'
Add modules
Instead of using a rc.local file, it is better to notify Firewalld through the /etc/modules-load.d directory.
Backup firewall rules
# iptables -S > firewalld_rules_ipv4
# ip6tables -S > firewalld_rules_ipv6

---
For the priority from highest to lowest for when and where a rule applies when a packet arrives we have:
  • Direct rules
  • Source address based zone
    • log
    • deny
    • allow
  • Interface based zone
    • log
    • deny
    • allow
  • Default zone
    • log
    • deny
    • allow
Within each log/deny/allow split of a zone the priority is:
  • Rich rule
  • Port definition
  • Service definition
---
  • The iptables service stores configuration in /etc/sysconfig/iptables while firewalld stores it in various XML files in /usr/lib/firewalld/ and /etc/firewalld/. Note that the /etc/sysconfig/iptables file does not exist as firewalld is installed by default on Red Hat Enterprise Linux.
  • With the iptables service, every single change means flushing all the old rules and reading all the new rules from /etc/sysconfig/iptables while with firewalld there is no re-creating of all the rules; only the differences are applied. Consequently, firewalld can change the settings during runtime without existing connections being lost.


---

1 Million TPS On $5K Hardware - 9/11/2012

Russ’ 10 Ingredient Recipe For Making 1 Million TPS On $5K Hardware

My name is Russell Sullivan, I am the author of AlchemyDB: a highly flexible NoSQL/SQL/DocumentStore/GraphDB-datastore built on top of redis. I have spent the last several years trying to find a way to sanely house multiple datastore-genres under one roof while (almost paradoxically) pushing performance to its limits.
I recently joined the NoSQL company Aerospike (formerly Citrusleaf) with the goal of incrementally grafting AlchemyDB’s flexible data-modeling capabilities onto Aerospike’s high-velocity horizontally-scalable key-value data-fabric. We recently completed a peak-performanceTPS optimization project: starting at 200K TPS, pushing to the recent community edition launch at 500K TPS, and finally arriving at our 2012 goal: 1M TPS on $5K hardware.
Getting to one million over-the-wire client-server database-requests per-second on a single machine costing $5K is a balance between trimming overhead on many axes and using a shared nothing architecture to isolate the paths taken by unique requests.
Even if you aren’t building a database server the techniques described in this post might be interesting as they are not database server specific. They could be applied to a ftp server, a static web server, and even to a dynamic web server.
Here is my personal recipe for getting to this TPS per dollar.

The Hardware

Hardware is important, but pretty cheap at 200 TPS per dollar spent:
  1. Dual Socket Intel motherboard
  2. 2*Intel X5690 Hexacore @3.47GHz
  3. 32GB DRAM 1333
  4. 2 NIC ports of an Intel quad-port NIC (each NIC has 8 queues)

Select The Right Ingredients

The architecture/software/OS ingredients used in order to get optimal peak-performance rely on the combination and tweaking of ALL of the ingredients to hit the sweet spot and achieve a VERY stable 1M database-read-requests per-second over-the-wire.
It is difficult to quantify the importance of each ingredient, but in general they are in order of descending importance.

Select The Right Architecture

First, it is imperative to start out with the right architecture, both vertical and horizontal scalability (which are essential for peak-performance on modern hardware) flow directly from architectural decisions:
1100% shared nothing architecture. This is what allows you to parallelize/isolate. Without this, you are eventually screwed when it comes to scaling.
2100% in-memory workload. Don’t even think about hitting disk for 0.0001% of these requests. SSDs are better than HDDs, but nothing beats DRAM for the dollar for this type of workload.
3. Data lookups should be dead-simple, i.e.:
  1. Get packet from event loop (event-driven)
  2. Parse action
  3. Lookup data in memory (this is fast enough to happen in-thread)
  4. Form response packet
  5. Send packet back via non-blocking call
4Data-Isolation. The previous lookup is lockless and requires no hand-off from thread-to-thread: this is where a shared-nothing architecture helps you out. You can determine which core on which machine a piece of data will be written-to/served-from and the client can map a tcp-port to this core and all lookups go straight to the data. The operating system will provide the multi-threading & concurrency for your system.

Select The Right OS, Programming Language, And Libraries

Next, make sure your operating system, programming language, and libraries are the ones proven to perform:
5. Modern Linux kernel. Anything less than CentOS 6.3 (kernel 2.6.32) has serious problems w/ software interrupts. This is also the space where we can expect a 2X improvement in the near future; the Linux kernel is currently being upgraded to improve multi-core efficiency.
6. The C language. Java may be fast, but not as fast as C, and more importantly: Java is less in your control and control is the only path to peak performance. The unknowns of garbage collection frustrate any and all attempts to attain peak performance.
7. Epoll. Event-driven/non-blocking I/O, single threaded event loop for high-speed code paths.

Tweak And Taste Until Everything Is Just Right

Finally, use the features of the system you have designed. Tweak the Hardware & OS toisolate performance critical paths:
8. Thread-Core-Pinning. Event loop threads reading and writing tcp packets should each be pinned to their own core and no other threads should be allowed on these cores. These threads are so critical to performance; any context switching on their designated cores will degrade peak-performance significantly.
9. IRQ affinity from the NIC. To avoid ALL soft interrupts (generated by tcp packets) bottlenecking on a single core. There are different methodologies depending on the number of cores you have:
  1. For QuadCore CPUs: round-robin spread IRQ affinity (of the NIC’s Queue’s) to the Network-facing-event-loop-threads (e.g. 8 Queue’s, map 2 Queue’s to each core)
  2. On Hexacore (and greater) CPUs: reserve 1+ cores to do nothing but IRQ-processing (i.e. send IRQ’s to these cores and don’t let any other thread run on these cores) and use ALL other cores for Network-facing-event-loop-threads (similarly running w/o competition on their own designated core). The core receiving the IRQ will then signal the recipient core and the packet has a near 100% chance of being in L3 cache, so the transport of the packet from core to core is near optimal.
10. CPU-Socket-Isolation via PhysicalNIC/PhysicalCPU pairing. Multiple CPU sockets holding multiple CPUs should be used like multiple machines. Avoid inter-CPU communication; it is dog-slow when compared to communication between cores on the same CPU die. Pairing a physical NIC port to a PhysicalCPU is a simple means to attain this goal and can be achieved in 2 steps:
  1. Use IRQ affinity from this physical NIC port to the cores on its designated PhysicalCPU
  2. Configure IP routing on each physical NIC port (interface) so packets are sent from its designated CPU back to the same interface (instead of to the default interface)
This technique isolates CPU/NIC pairs; when the client respects this, a Dual-CPU-socket machine works like 2 single-CPU-socket machines (at a much lower TCO).
That is it. The 10 ingredients are fairly straightforward, but putting them all together, and making your system really hum, turns out to be a pretty difficult balancing act in practice. The basic philosophy is to isolate on all axis.

The Proof Is Always In The Pudding

Any 10 step recipe is best illustrated via an example: the client knows (via multiple hashings) that dataX is presently on core8 of ipY, which has a predefined mapping of going to ipY:portZ.
The connection from the client to ipY:portZ has previously been created, the request goes from the client to ipY:(NIC2):portZ.
  • NIC2 sends all of its IRQs to CPU2, where the packet gets to core8 w/ minimal hardware/OS overhead.
  • The packet creates an event, which triggers a dedicated thread that runs w/o competition on core8.
  • The packet is parsed; the operation is to look up dataX, which will be in its local NUMA memory pool.
  • DataX is retrieved from local memory, which is a fast enough operation to not benefit from context switching.
  • The thread then replies with a non-blocking packet that goes back thru only cores on the local CPU2, which sends ALL of its IRQs to NIC2.
Everything is isolated and nothing collides (e.g. w/ NIC1/CPU1). Software interrupts are handled locally on a CPU. IRQ affinity insures software interrupts don’t bottleneck on a single core and that they come from and go from/to their designated NIC. Core-to-core communication happens ONLY withIN the CPU die. There are no unnecessary context switches on performance-critical code paths. TCP packets are processed as events by a single thread running dedicated on its own core. Data is looked up in the local memory pool. This isolated path is the closest software path to what actually physically happens in a computer and the key to attaining peak performance.
At Aerospike, I knew I had it right when I watched the output of the “top” command, (viewing all cores) and there was near zero idle % cpu and also a very uniform balance across cores. Each core had exactly the same signature, something like: us%39 sy%35 id%0 wa%0 si%22.
Which is to say software-interrupts from tcp packets were using 22% of the core, context switches passing tcp-packets back and forth from the operating system were taking up 35%, and our software was taking up 39% to do the database transaction.
When the perfect balance across cores was achieved optimal performance was achieved, from an architectural standpoint. We can still streamline our software but at least the flow of packets to & fro Aerospike is near optimal.

Data Is Served

Those are my 10 ingredients that got Aerospike’s server to one million over-the-wire database requests on a $5K commodity machine. Mixed correctly, they not only give you incredible raw speed, they give you stability/predictability/over-provisioning-for-spikes at lower speeds. Enjoy ☺

Facebook’s vs Twitter’s Approach to Real-Time Analytics - 10/19/2013

Facebook’s vs Twitter’s Approach to Real-Time Analytics

Last year, Twitter and Facebook have released new versions of their real-time analytics systems.
In both cases, the motivation was relatively similar — they wanted to provide their customers with better insights on the performance and effectiveness of their marketing activities. Facebook’s measurement includes “likes” and “comments” to monitor interactions. For Twitter, the measurement is based on the effectiveness of a given tweet – typically called “Reach” – basically a measure of the number of followers that were exposed to the tweet. Beyond the initial exposure, you often want to measure the number of clicks on that tweet, which indicate the number of users who saw the tweet and also looked into its content.
Facebook’s vs Twitter’s Approach to real-time Analytics 
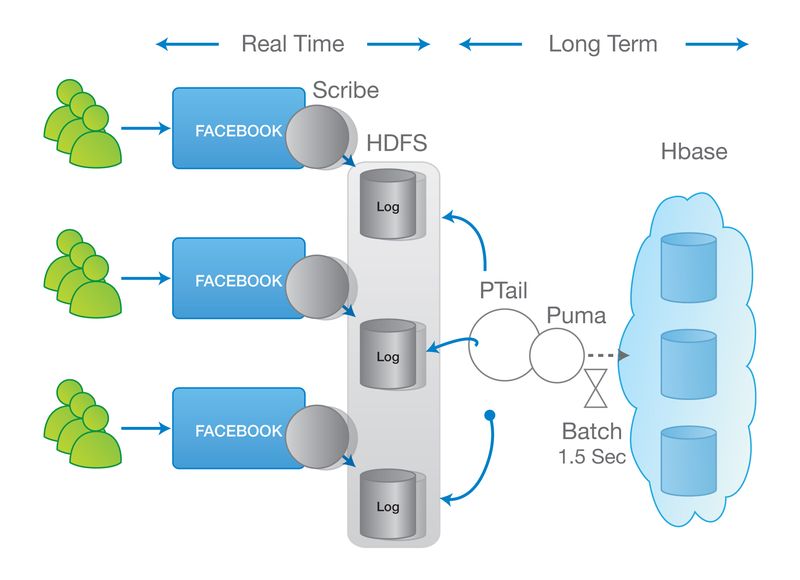
Facebook Real-Time Analytics Architecture – Logging-Centric Approach:
Diagram1
Relies on Apache Hadoop framework for real-time and batch (map/reduce) processing. Using the same underlying system simplifies the maintenance of that system.
  • Limited real-time processing — the logging-centric approach basically delegates most of the heavy lifting to the backend system. Performing even a fairly simple correlation beyond simple counting isn’t a trivial task.
  • real-time is often measured in tens of seconds. In many analytics system, this order of magnitude is often more than enough to express a real-time view of what is going on in your system.
  • It is suitable for simple processing. Because of the logging nature of the Facebook architecture, most of the heavy lifting of processing cannot be done in real-time and is often pushed into the backend system.
  • Low parallelization — Hadoop systems do not give you ways to ensure ordering and consistency based on the data. Because of that, Facebook came up with their Puma service that collects and inputs data into a centralized service, thus making it easier to processes events in order.
  • Facebook collects user click streams from your Facebook wall through an Ajax listener which, then, sends those events back into the Facebook data centers. The info is stored on Hadoop File System via Scribe and collected by PTail.
  • Puma aggregates logs in-memory, batching them in windows of 1.5 seconds and stores the information in Hbase.
  • The Facebook approach puts a huge limit as to the volume of events that the system can handle and have significant implications over the utilization of the overall system.

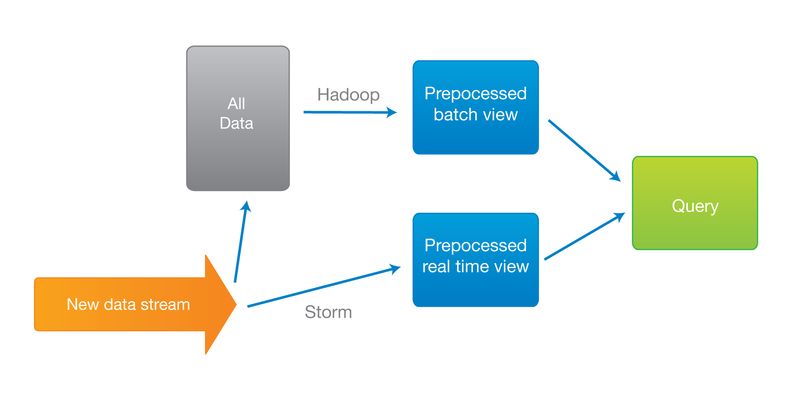
Twitter Real-Time Analytics Architecture – Event-Driven Approach:
Diagram2
  • Unlike Facebook, Twitter uses Hadoop for batch processing and Storm for real-time processing. Storm was designed to perform fairly complex aggregation of the data that comes through the stream as it flows into the system, before it is sent back to the batch system for further analysis.
  • Real-time can be measured in milliseconds. While having second or millisecond latency is not crucial to the end user — it does have a significant effect on the overall processing time and the level of analysis that we can produce and push through the system. As many of those analyses involve thousands of operations to get to the actual result.
  • It is suitable for complex processing. With Storm, it is possible to perform a large range of complex aggregation while the data flows through the system. This has a significant impact on the complexity of the processing. A good example is calculating trending words. With the event-driven approach, we can assume that we have the current state and just make the change to that state to update the list of trending words. In contrast, a batch system will have to read the entire set of words, re-calculate, and re-order the words for every update. This is why those operations are often done in long batches.
  • Extremely parallel – Asynchronous events are, by definition, easier to parallelize. Storm was designed for extreme parallelization. Ultimately, it determines the speed level of utilization that we can get per machine in our system. Looking at the bigger picture, this quite substantially adds to the cost of our system and to our ability to perform complex analyses.
Final Words
Quite often, we get caught in the technical details of these discussions and lose sight of what this all really means.
If all you are looking for is to collect data streams and simply update counters, then both approaches would work. The main difference between the two is felt in the level and complexity of processing that you would like to process in real-time. If you want to continuously update a different form of sorted lists or indexes, you’ll find that doing so in an event-driven approach, as is the case of Twitter, can be exponentially faster and more efficient than the logging-centric approach. To put some numbers behind that, Twitter reported that calculating the reach without Storm took 2 hours whereas Storm could do the same in less than a second.
Such a difference in speed and utilization have a direct correlation with the business bottom line, as it determines the level and depth of intelligence that it can run against its data. It also determines the cost of running the analytics systems and, in some cases, the availability of those systems. When the processing is slower there would be larger number of scenarios that could saturate the system.

Wix - 11/11/2014

Nifty Architecture Tricks From Wix – Building A Publishing Platform At Scale

15724861706_3a81497b37_m
Wix operates websites in the long tale. As a HTML5 based WYSIWYG web publishing platform, they have created over 54 million websites, most of which receive under 100 page views per day. So traditional caching strategies don’t apply, yet it only takes four web servers to handle all the traffic. That takes some smart work.
Aviran Mordo, Head of Back-End Engineering at Wix, has described their solution in an excellent talk: Wix Architecture at Scale. What they’ve developed is in the best tradition of scaling is specialization. They’ve carefully analyzed their system and figured out how to meet their aggressive high availability and high performance goals in some most interesting ways.
Wix uses multiple datacenters and clouds. Something I haven’t seen before is that they replicate data to multiple datacenters, to Google Compute Engine, and to Amazon. And they have fallback strategies between them in case of failure.
Wix doesn’t use transactions. Instead, all data is immutable and they use a simple eventual consistency strategy that perfectly matches their use case.
Wix doesn’t cache (as in a big caching layer). Instead, they pay great attention to optimizing the rendering path so that every page displays in under 100ms.
Wix started small, with a monolithic architecture, and has consciously moved to a service architectureusing a very deliberate process for identifying services that can help anyone thinking about the same move.
This is not your traditional LAMP stack or native cloud anything. Wix is a little different and there’s something here you can learn from. Let’s see how they do it…

Stats

  • 54+ million websites, 1 million new websites per month.
  • 800+ terabytes of static data, 1.5 terabytes of new files per day
  • 3 data centers + 2 clouds (Google, Amazon)
  • 300 servers
  • 700 million HTTP requests per day
  • 600 people total, 200 people in R&D
  • About 50 services.
  • 4 public servers are needed to serve 45 million websites

Platform

  • MySQL
  • Google and Amazon clouds
  • CDN
  • Chef

Evolution

  • Simple initial monolithic architecture. Started with one app server. That’s the simplest way to get started. Make quick changes and deploy. It gets you to a particular point.
    • Tomcat, Hibernate, custom web framework
    • Used stateful logins.
    • Disregarded any notion of performance and scaling.
  • Fast forward two years.
    • Still one monolithic server that did everything.
    • At a certain scale of developers and customers it held them back.
    • Problems with dependencies between features. Changes in one place caused deployment of the whole system. Failure in unrelated areas caused system wide downtime.
  • Time to break the system apart.
    • Went with a services approach, but it’s not that easy. How are you going to break functionality apart and into services?
    • Looked at what users are doing in the system and identified three main parts: edit websites, view sites created by Wix, serving media.
    • Editing web sites includes data validation of data from the server, security and authentication, data consistency, and lots of data modification requests.
    • Once finished with the web site users will view it. There are 10x more viewers than editors. So the concerns are now:
      • high availability. HA is the most important feature because it’s the user’s business.
      • high performance
      • high traffic volume
      • the long tail. There are a lot of websites, but they are very small. Every site gets maybe 10 or 100 page views a day. The long tail make caching not the go to scalability strategy. Caching becomes very inefficient.
    • Media serving is the next big service. Includes HTML, javascript, css, images. Needed a way to serve files the 800TB of data under a high volume of requests. The win is static content is highly cacheable.
    • The new system looks like a networking layer that sits below three segment services: editor segment (anything that edits data), media segment (handles static files, read-only), public segment (first place a file is viewed, read-only).

Guidelines For How To Build Services

  • Each service has its own database and only one service can write to a database.
  • Access to a database is only through service APIs. This supports a separation of concerns and hiding the data model from other services.
  • For performance reasons read-only access is granted to other services, but only one service can write. (yes, this contradicts what was said before)
  • Services are stateless. This makes horizontal scaling easy. Just add more servers.
  • No transactions. With the exception of billing/financial transactions, all other services do not use transactions. The idea is to increase database performance by removing transaction overhead. This makes you think about how the data is modeled to have logical transactions, avoiding inconsistent states, without using database transactions.
  • When designing a new service caching is not part of the architecture. First, make a service as performant as possible, then deploy to production, see how it performs, only then, if there are performance issues, and you can’t optimize the code (or other layers), only then add caching.

Editor Segment

  • Editor server must handle lots of files.
  • Data stored as immutable JSON pages (~2.5 million per day) in MySQL.
  • MySQL is a great key-value store. Key is based on a hash function of the file so the key is immutable. Accessing MySQL by primary key is very fast and efficient.
  • Scalability is about tradeoffs. What tradeoffs are we going to make? Didn’t want to use NoSQL because they sacrifice consistency and most developers do not know how to deal with that. So stick with MySQL.
  • Active database. Found after a site has been built only 6% were still being updated. Given this then these active sites can be stored in one database that is really fast and relatively small in terms of storage (2TB).
  • Archive database. All the stale site data, for sites that are infrequently accessed, is moved over into another database that is relatively slow, but has huge amounts of storage. After three months data is pushed to this database is accesses are low. (one could argue this is an implicit caching strategy).
  • Gives a lot of breathing room to grow. The large archive database is slow, but it doesn’t matter because the data isn’t used that often. On first access the data comes from the archive database, but then it is moved to the active database so later accesses are fast.

High Availability For Editor Segment

  • With a lot of data it’s hard to provide high availability for everything. So look at the critical path, which for a website is the content of the website. If a widget has problems most of the website will still work. Invested a lot in protecting the critical path.
  • Protect against database crashes. Want to recover quickly. Replicate databases and failover to the secondary database.
  • Protect against data corruption and data poisoning.  Doesn’t have to be malicious, a bug is enough to spoil the barrel. All data is immutable. Revisions are stored for everything. Worst case  if corruption can’t be fixed is to revert to version where the data was fine.
  • Protect against unavailability. A website has to work all the time. This drove an investment inreplicating data across different geographical locations and multiple clouds. This makes the system very resilient.
    • Clicking save on a website editing session sends a JSON file to the editor server.
    • The server sends the page to the active MySQL server which is replicated to another datacenter.
    • After the page is saved to locally, an asynchronous process is kicked upload the data to a static grid, which is the Media Segment.
    • After data is uploaded to the static grid, a notification is sent to a archive service running on the Google Compute Engine. The archive goes to the grid, downloads a page, and stores a copy on the Google cloud.
    • Then a notification is sent back to the editor saying the page was saved to GCE.
    • Another copy is saved to Amazon from GCE.
    • One the final notification is received it means there are three copies of the current revision of data: one in the database, the static grid, and on GCE.
    • For the current revision there are three copies. For old revision there two revisions (static grid, GCE).
    • The process is self-healing. If there’s a failure the next time a user updates their website everything that wasn’t uploaded will be uploaded again.
    • Orphan files are garbage collected.

Modeling Data With No Database Transactions

  • Don’t want a situation where a user edit two pages and only one page is saved in the database, which is an inconsistent state.
  • Take all the JSON files and stick them in the database one after the other. When all the files are saved another save command is issued which contains a manifest of all the IDs (which is hash of the content which is the file name on the static server) of the saved pages that were uploaded to the static servers.

Media Segment

  • Stores lots of files. 800TB of user media files, 3M files uploaded daily, and 500M metadata records.
  • Images are modified. They are resized for different devices and sharpened. Watermarks can be inserted and there’s also audio format conversion.
  • Built an eventually consistent distributed file system that is multi datacenter aware with automatic fallback across DCs. This is before Amazon.
  • A pain to run. 32 servers, doubling the number every 9 months.
  • Plan to push stuff to the cloud to help scale.
  • Vendor lock-in is a myth. It’s all APIs. Just change the implementation and you can move to different clouds in weeks.
  • What really locks you down is data. Moving 800TB of data to a different cloud is really hard.
  • They broke Google Compute Engine when they moved all their data into GCE. They reached the limits of the Google cloud. After some changes by Google it now works.
  • Files are immutable so the are highly cacheable.
  • Image requests first go to a CDN. If the image isn’t in the CDN the request goes to their primary datacenter in Austin. If the image isn’t in Austin the request then goes to Google Cloud. If it’s not in Google cloud it goes to a datacenter in Tampa.

Public Segment

  • Resolve URLs (45 million of them), dispatch to the appropriate renderer, and then render into HTML, sitemap XML, or robots TXT, etc.
  • Public SLA is that response time is < 100ms at peak traffic. Websites have to be available, but also fast. Remember, no caching.
  • When a user clicks publish after editing a page, the manifest, which contains references to pages, are pushed to Public. The routing table is also published.
  • Minimize out-of-service hops. Requires 1 database call to resolve the route. 1 RPC call to dispatch the request to the renderer. 1 database call to get the site manifest.
  • Lookup tables are cached in memory and are updated every 5 minutes.
  • Data is not stored in the same format as it is for the editor. It is stored in a denormalized format, optimized for read by primary key. Everything that is needed is returned in a single request.
  • Minimize business logic. The data is denormalized and precalculated. When you handle large scale every operation, every millisecond you add, it’s times 45 million, so every operation that happens on the public server has to be justified.
  • Page rendering.
    • The html returned by the public server is bootstrap html. It’s a shell with JavaScript imports and JSON data with references to site manifest and dynamic data.
    • Rendering is offloaded to the client. Laptops and mobile devices are very fast and can handle the rendering.
    • JSON was chosen because it’s easy to parse and compressible.
    • It’s easier to fix bugs on the client. Just redeploy new client code. When rendering is done on the server the html will be cached, so fixing a bug requires re-rendering millions of websites again.

High Availability For Public Segment

  • Goal is to be always available, but stuff happens.
  • On a good day: a browser makes a request, the request goes to a datacenter, through a load balancer, goes to a public server, resolves the route, goes to the renderer, the html goes back to the browser, and the browser runs the javascript. The javascript fetches all media files and the JSON data and renders a very beautiful web site. The browser then make a request to the Archive service. The Archive service replays the request in the same way the browser does and stores the data in a cache.
  • On a bad day a datacenter is lost, which did happen. All the UPSs died and the datacenter was down. The DNS was changed and then all the requests went to the secondary datacenter.
  • On a bad day Public is lost. This happened once when a load balancer got half of a configuration so all the Public servers were gone. Or a bad version can be deployed that starts returning errors. Custom code in the load balancer handles this problem by routing to the Archive service to fetch the cached if the Public servers are not available. This approach meant customers were not affected when Public went down, even though the system was reverberating with alarms at the time.
  • On a bad day the Internet sucks. The browser makes a request, goes to the datacenter, goes to the load balancer, gets the html back. Now the JavaScript code has to fetch all the pages and JSON data. It goes to the CDN, it goes to the static grid and fetches all the JSON files to render the site. In these processes Internet problems can prevent files from being returned. Code in JavaScript says if you can’t get to the primary location, try and get it from the archive service, if that fails try the editor database.

Lessons Learned

  • Identify your critical path and concerns. Think through how your product works. Develop usage scenarios. Focus your efforts on these as they give the biggest bang for the buck.
  • Go multi-datacenter and multi-cloud. Build redundancy on the critical path (for availability).
  • De-normalize data and Minimize out-of-process hops (for performance). Precaluclate and do everything possible to minimize network chatter.
  • Take advantage of client’s CPU power. It saves on your server count and it’s also easier to fix bugs in the client.
  • Start small, get it done, then figure out where to go next. Wix did what they needed to do to get their product working. Then they methodically moved to a sophisticated services architecture.
  • The long tail requires a different approach. Rather than cache everything Wix chose to optimize the heck out of the render path and keep data in both an active and archive databases.
  • Go immutable. Immutability has far reaching consequences for an architecture. It affects everything from the client through the back-end. It’s an elegant solution to a lot of problems.
  • Vendor lock-in is a myth. It’s all APIs. Just change the implementation and you can move to different clouds in weeks.
  • What really locks you down is data. Moving lots of data to a different cloud is really hard.